Ask AI for a Dataset, Get a Meme Back: Turning a Joke Into Real Data
Most of the datasets on this blog started as spreadsheets. This one started as a joke.
The premise: "gaze long enough into the Bluesky abyss and, eventually, the abyss vomits up a Sankey diagram." Not a real business question. Not something anyone was tracking. Just a bit, the kind of thing you'd post and move on from. Except a bit is still a story, and a story with stages and something flowing through it is still a dataset waiting to happen.
The dataset that came out of the joke
Turning the premise into data just meant asking: what are the stages? Someone opens the app, scrolls, ends up somewhere. Working backward from the punchline, the shape wrote itself:
Open Bluesky leads to Scrolling the Feed, which splits into a few flavors of content (a discourse thread, some reply guys, a screenshot of a screenshot), all of which funnel into The Abyss. The Abyss itself splits into two outputs, Existential Dread and a Quote-Post Spiral, and both of those converge on the punchline: A Sankey Diagram.
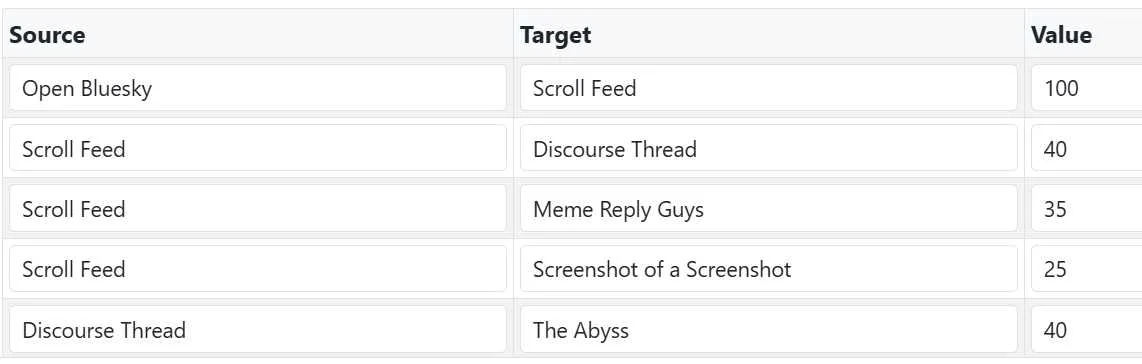
Every node's inflow matches its outflow, same as any real dataset needs to. It's a joke, but it's a structurally sound joke.
Note: We asked Claude to generate a Source, Target, Value based on the prompt: gaze long enough into the Bluesky abyss and, eventually, the abyss vomits up a Sankey diagram.
What Visual Prompts actually did with it
This is the part that made it worth writing up. Point Visualizer at that diagram, and it doesn't just illustrate "a person on their phone." It reads the whole shape: the fan-out, the convergence point, the second fan-out, the final punchline node, and builds a scene where all of that is happening at once, a phone feeding directly into a literal hole in the ground, content streams pouring down into it, and the hole vomiting back out toward the finish.
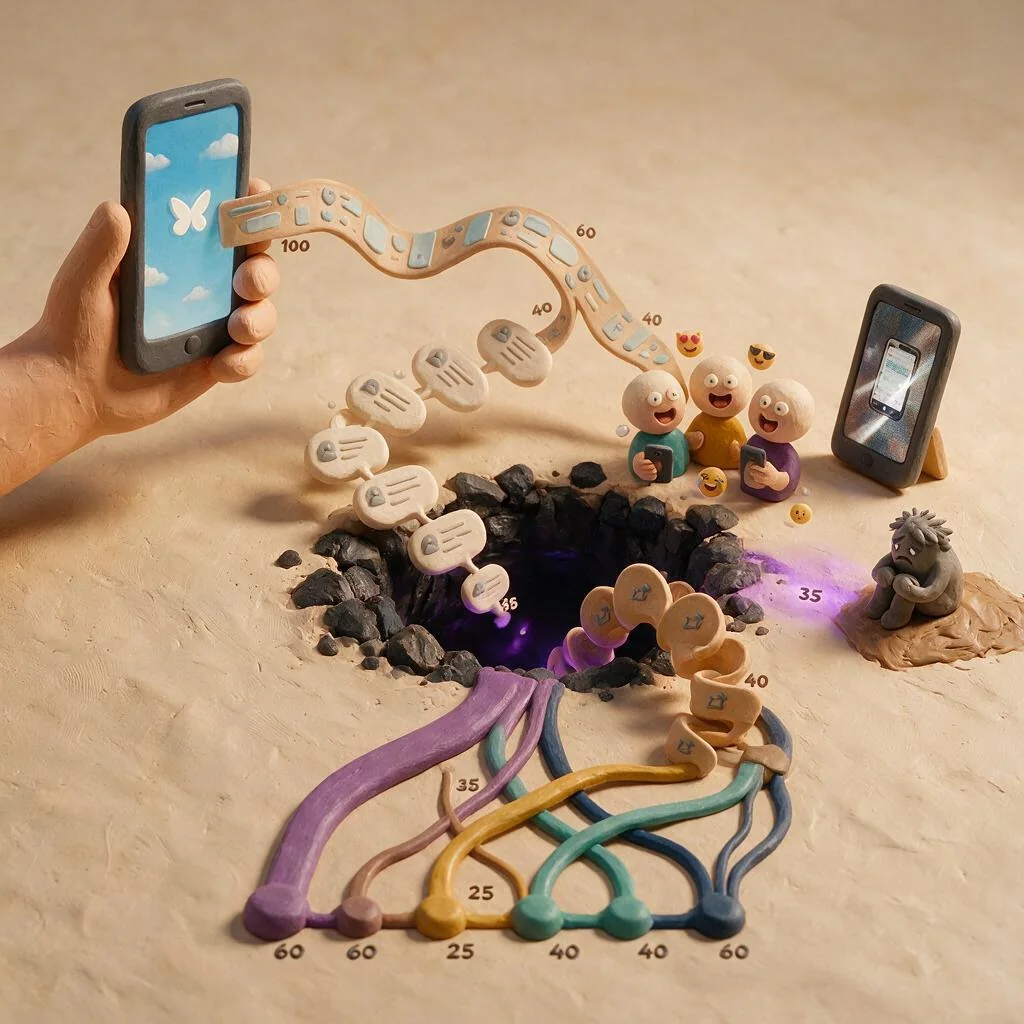
Every value from the dataset shows up as on-image text exactly where that flow actually happens in the diagram, not just scattered around the scene. The numbers next to the phone are the numbers on that edge of the actual Sankey. The bit didn't just get illustrated, it got illustrated accurately, which is a strange sentence to write about a joke, but that's the value of starting from real, structured data instead of a single freeform image prompt.
Try it yourself: the meme that keeps coming back
Here's a template dataset for a different bit, one with the same "there's a real shape hiding in this joke"...the task that will not stay closed.
Everyone who's worked on a team knows this one. A task gets assigned. It gets handled somehow, sprinted, deprioritized, snoozed. It gets marked done. And then it comes back, again and again, no matter how many times someone closes it.
| Source | Target | Value |
|---|---|---|
| Task Created | Assigned To Someone | 100 |
| Assigned To Someone | Sprint Backlog | 40 |
| Assigned To Someone | Deprioritized | 35 |
| Assigned To Someone | Snoozed Reminder | 25 |
| Sprint Backlog | Marked Done | 40 |
| Deprioritized | Marked Done | 35 |
| Snoozed Reminder | Marked Done | 25 |
| Marked Done | QA Reopens It | 60 |
| Marked Done | Requirements Changed | 40 |
| QA Reopens It | I'll Be Back | 60 |
| Requirements Changed | I'll Be Back | 40 |
Same hourglass shape as the abyss dataset on purpose: fan out into how a task gets handled, converge on "Marked Done," fan back out into the two ways it dies again, converge on the punchline. The structure is what makes it visually satisfying once it's a diagram, not the specific joke.

Picking the visual, without picking a real person
The obvious reference for "I'll Be Back" is a specific actor's most famous line. Don't use it. Visual Prompts generates real image-generation prompts meant to actually render whoever's described, and pointing that at a real, identifiable person's likeness isn't something to build a demo around, however tempting the joke.
The good news: the design does all the work without needing the actor. A chrome-skulled cyborg with a glowing red eye and a leather jacket reads as "that guy" to basically everyone, instantly, without being a picture of anyone in particular. Set the style to Cyberpunk, one of Visual Prompts' ten built-in styles. The joke lands. Nobody's likeness is involved. The hand is a dead give a way in Slide 2.
Overview Slide: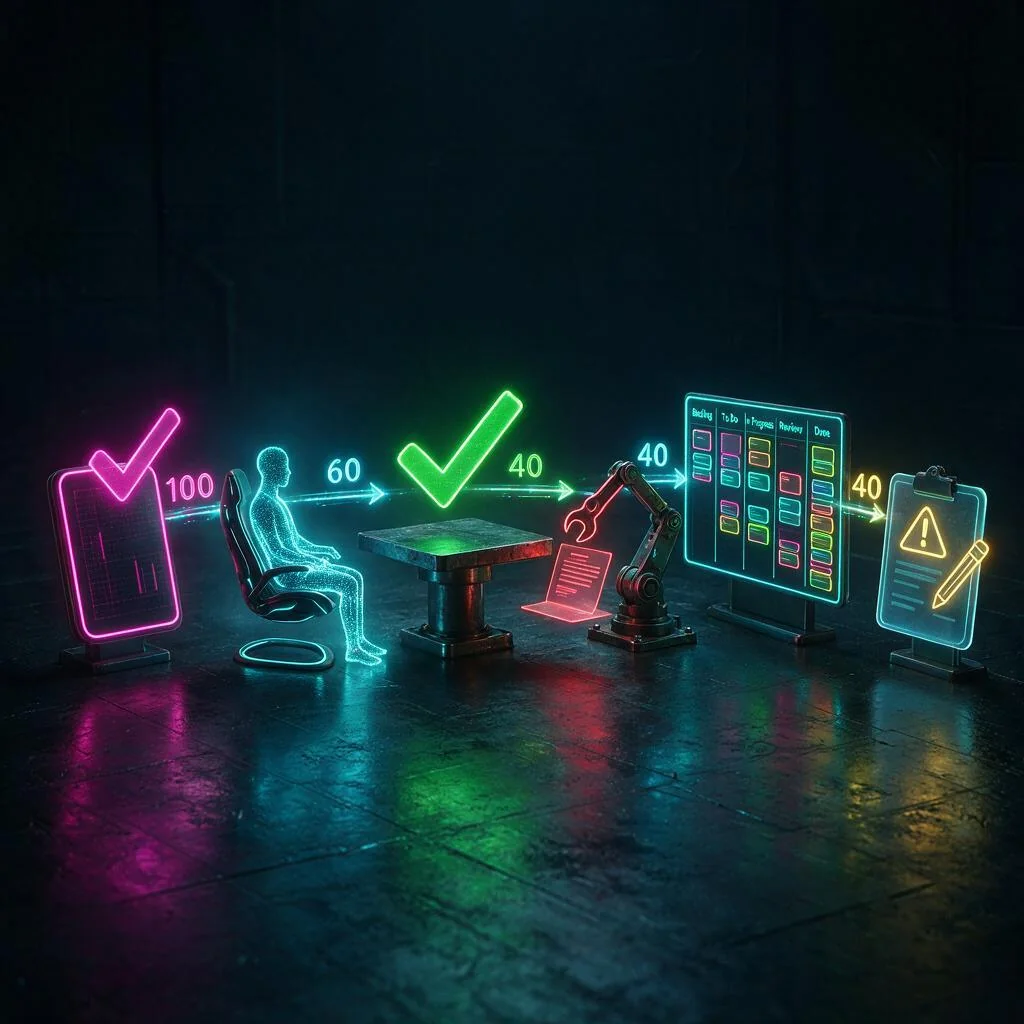
Slide 1. Task Creation and Assignment (100):

Slide 2. Workflow Loops and Backlog. The hand is a nice touch.
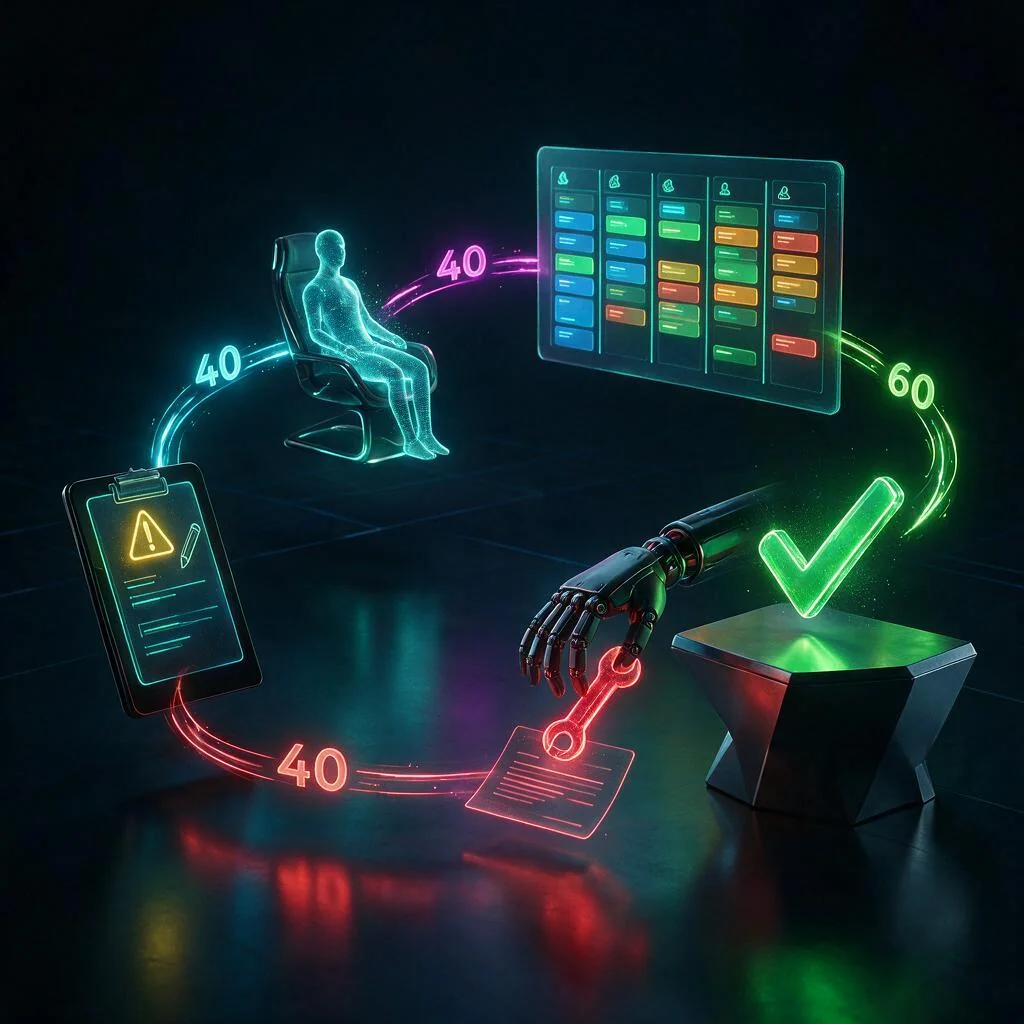
- Marked Done → QA Reopens It: 60
- Assigned To Someone → Sprint Backlog: 40
- Sprint Backlog → Marked Done: 40
- Marked Done → Requirements Changed: 40
AI generated images created with https://wavespeed.ai/image-generator
Try it
The next meme you think of probably has a shape hiding in it: a start, some branching, a place everything funnels toward. Write down the stages, turn them into three columns, and see what comes back.
Discussion